How do I display 10-minute and two-hour bars in MetaTrader4?
MetaTrader4 is highly sophisticated chart software but it does not come equipped with time displays such as two-hour bar display and ten-minute bar display used by many traders as standard.
However, using indicators enables you to not only use these time displays but also display arbitrary hour bars such as a 13-minute bar and a seven-hour bar.
Use the indicator called Period_Converter_Opt.mq4.
Like other custom indicators, store this indicator in the "indicators" folder by selecting [My Computer] --> [Program Files] --> [MetaTrader 4] --> [experts] -->[indicators].
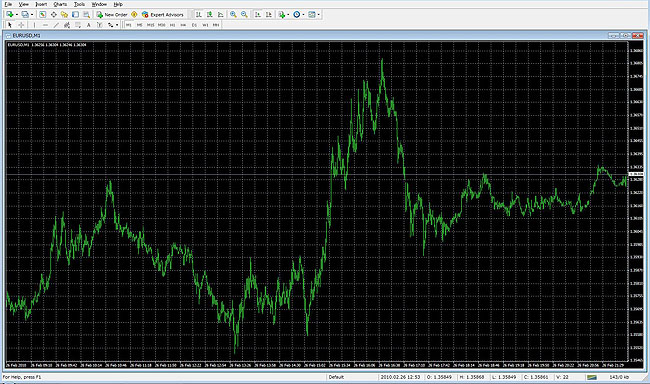
When displaying 10-minute bars (EURUSD)
First, display EURUSD 1M.
Next, drag the custom indicator Period_Converter_Opt stored in the "indicators" folder to the chart.
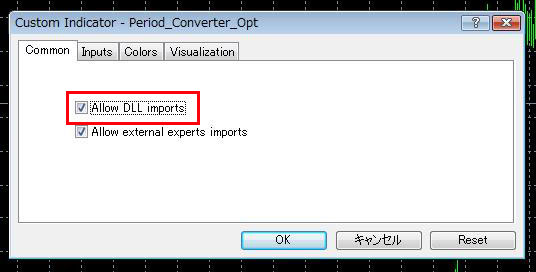
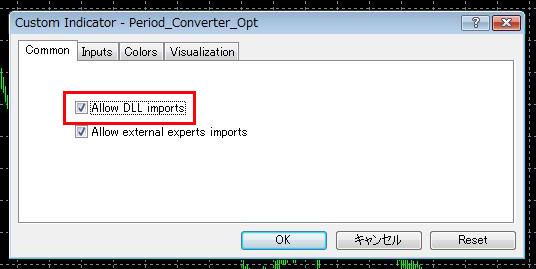
When an indicator configuration window (Custom Indicator) appears, select the [Allow DLL imports] check box of the [Common] tab.
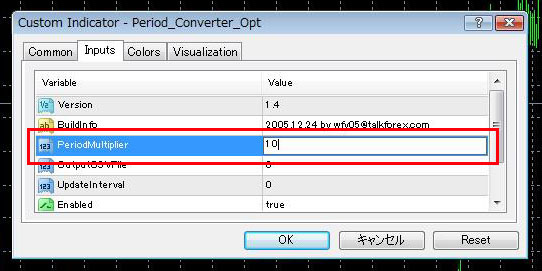
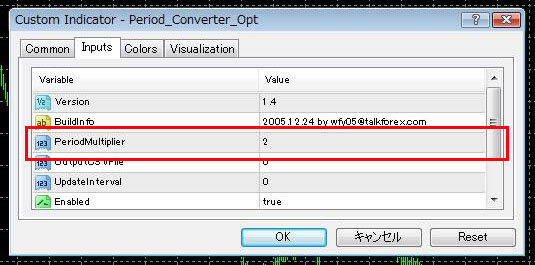
On the [Inputs] tab, type "10" from PeriodMultiplier.
(For example, if you want to create a three-minute bar, type "3" from here.)
After typing "10", click the [OK] button.
A nondescript 1M chart remains, but it serves as a background.
Leave this chart without deleting it because a 10M chart is run.
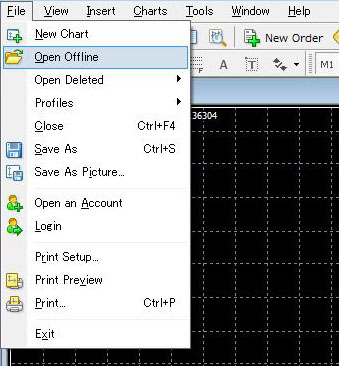
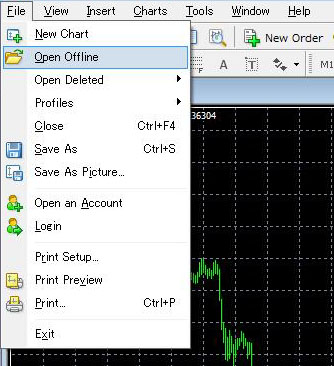
Next, select [File] --> [Open Offline].
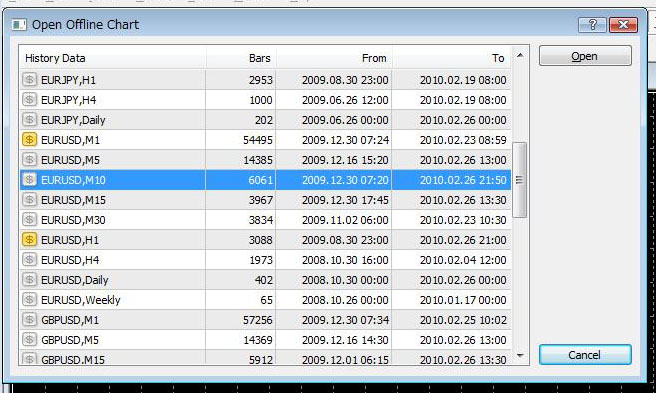
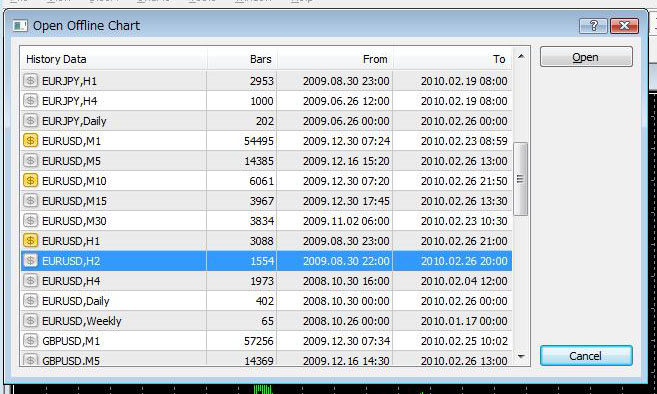
When the [Open Offline Chart] window appears, select EURUSD, M10 and click the [Open] button.
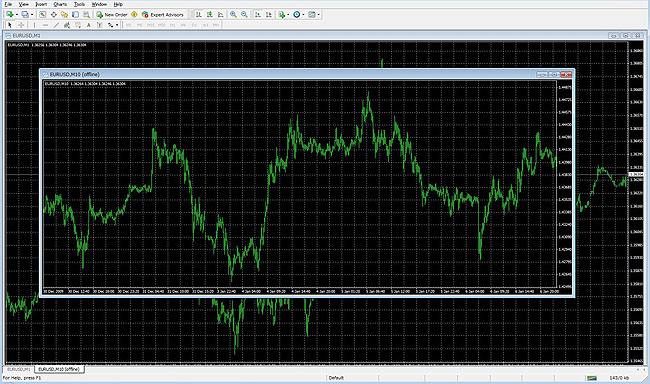
Then a 10M chart will be created.
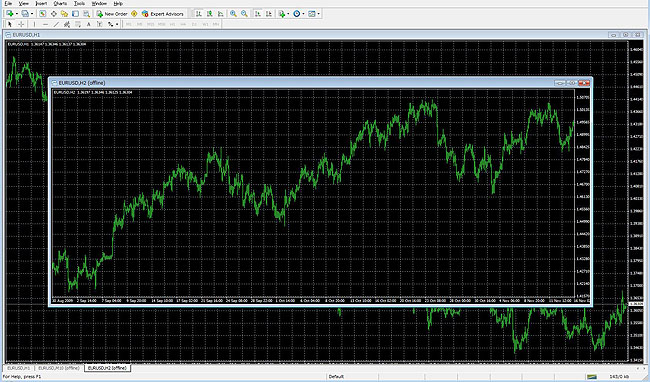
When displaying two-hour bars (EURUSD)
First, display EURUSD 1H.
Next, drag the custom indicator Period_Converter_Opt stored in the "indicators" folder to the chart.
When an indicator configuration window (Custom Indicator) appears, select the [Allow DLL imports] check box of the [Commonl] tab.
On the [Inputs] tab, check that "2" is set in PeriodMultiplier.
(For example, if you want to create a three-hour bar, type "3" from here.)
After the check, click the [OK] button.
A nondescript 1H chart remains, but it serves as a background.
Leave this chart without deleting it because a 2H chart is run.
Next, select [File] --> [Open Offline].
When the [Open Offline Chart] window appears, select EURUSD, H2 and click the [Open] button.
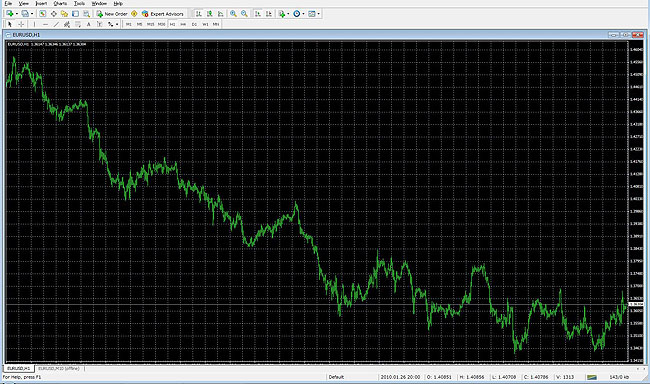
Then a 2H chart will be created.